
Gummy Cavity Map RFQ: Design the Tray From Output
Plan gummy cavity count and layout from target grams, pieces per hour, tray envelope, filling method, support and demolding rather than maximum packing density.
On this page
# Gummy Cavity Map RFQ: Design the Tray From Output
The maximum number of cavities that fit in a rectangle is not automatically the best production layout.
A useful cavity map balances:
- target piece weight
- pieces per hour
- tray size
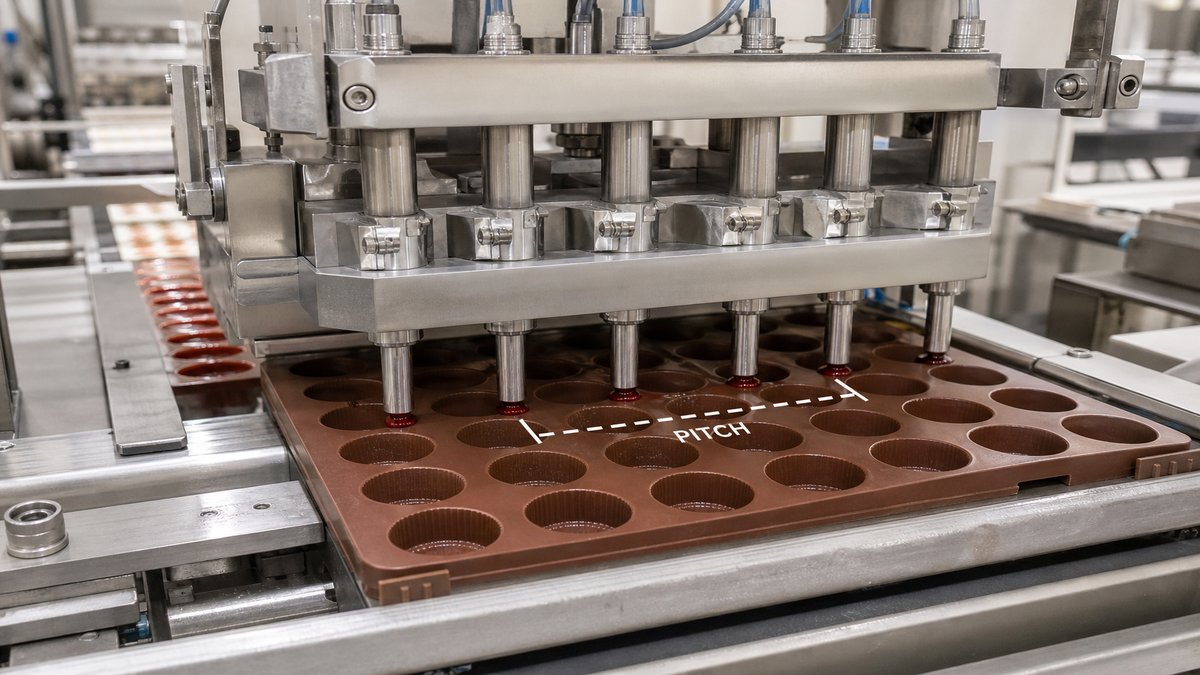
- machine pitch
- cavity spacing
- support
- demolding
- cleaning
- operator handling
Start With Output
A weak RFQ says:
> Fit as many cavities as possible.
A stronger RFQ says:
> We need 18,000 pieces/hour at the target piece weight, using our current depositor and rack format.
Now layout can follow production.
Basic Throughput Logic
At a high level:
pieces/hour = cavities filled per cycle × cycles/hour
But real output also includes:
- indexing
- tray change
- cooling/drying
- demolding
- cleaning
- rejects
More cavities can reduce cycle speed.
What a Cavity Map Should Show
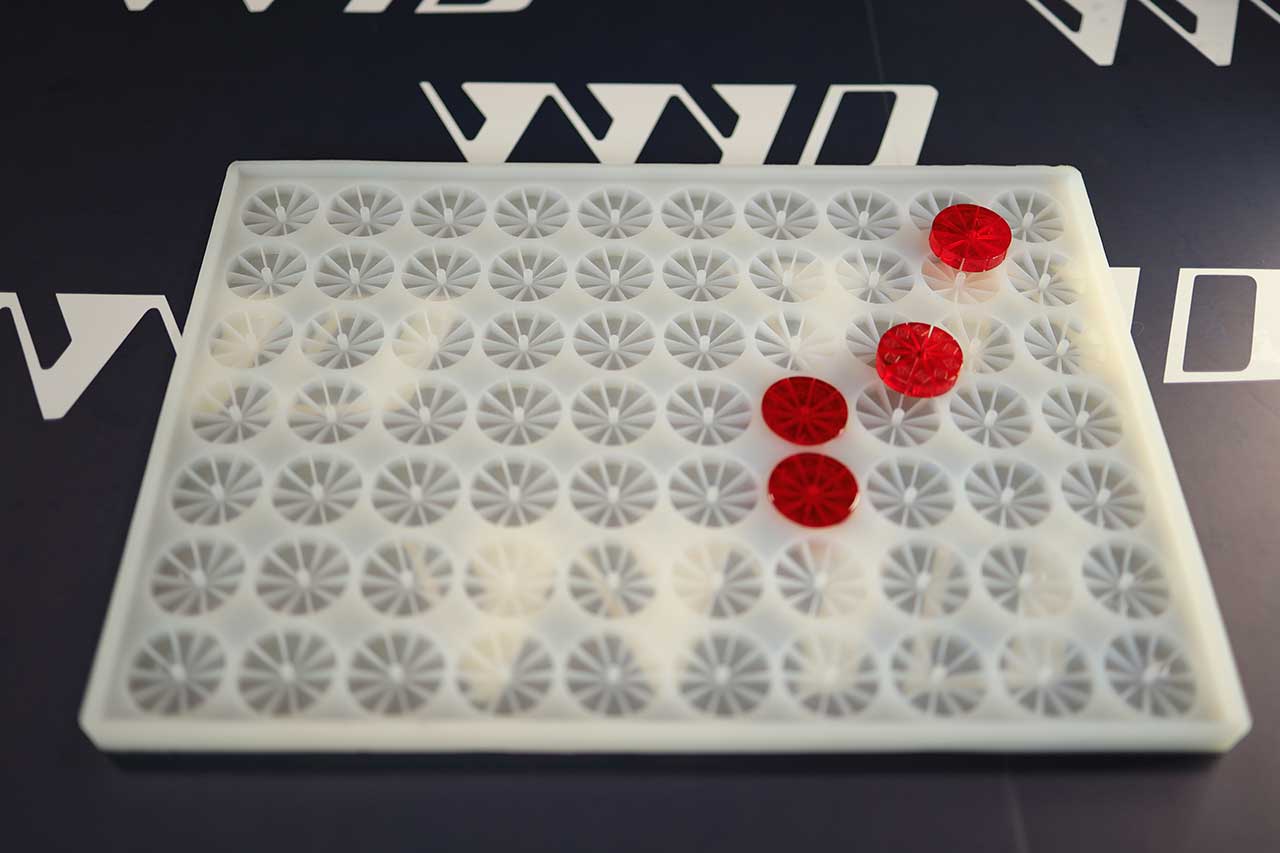
- row count
- cavities per row
- center coordinates
- row spacing
- cavity pitch
- edge margins
- orientation
- logo direction
- machine datum
- numbering if needed
Edge Margin Is Structural
Unused edge space can provide:
- grip
- stiffness
- nest support
- protection for outer cavities
- locating features
Do not treat every millimeter not containing a cavity as wasted material.
Cavity Density and Web Strength
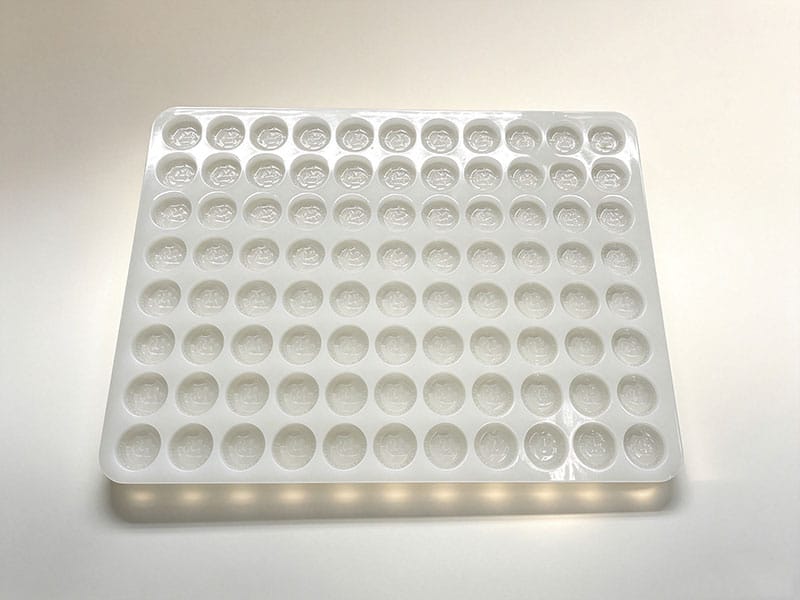
Aggressive packing can create narrow webs.
That can increase:
- tearing
- ripple
- handling difficulty
- local deformation
- cleaning difficulty
The layout should consider structural webs as part of the tray.
Piece Weight
Cavity volume should be linked to the actual formula.
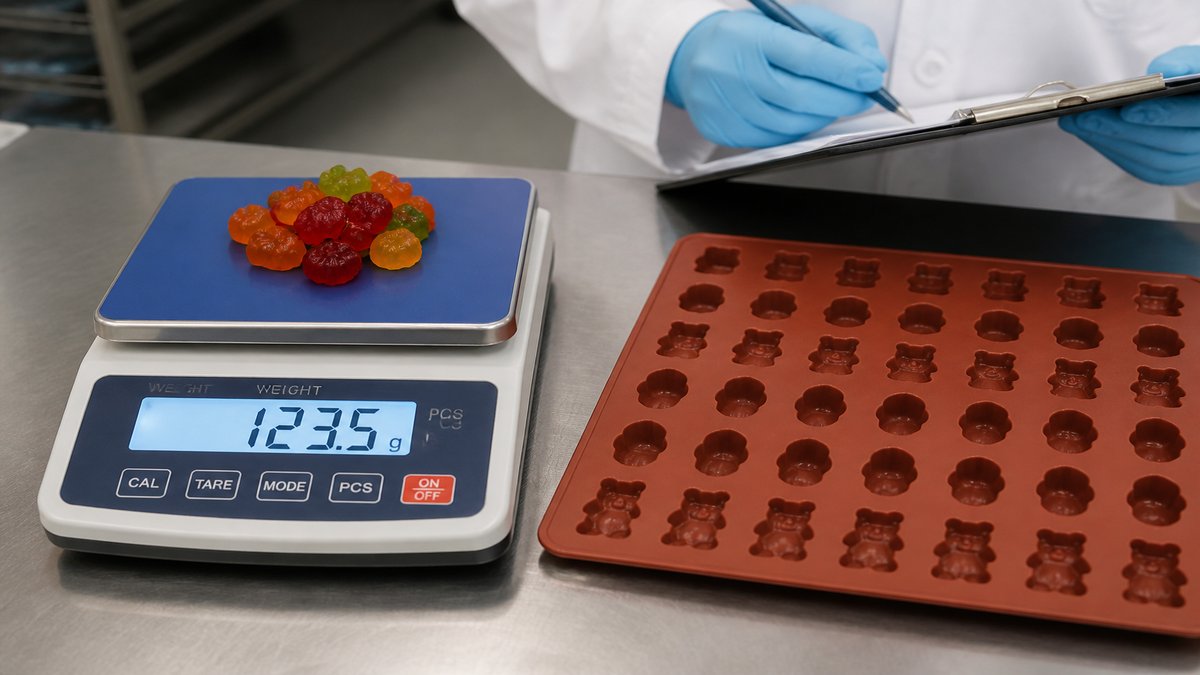
Do not assume 1 mL equals 1 g for every gummy system.
Prototype the real formulation and compare finished piece weights.
Manual vs Automatic Filling
Manual filling may tolerate more layout freedom.
Automatic depositors require:
- correct pitch
- first-cavity datum
- stable tray plane
- repeatable support
The cavity map should inherit those machine constraints.
Demolding Labor
Track:
- pieces released per minute
- whether rows can peel together
- whether fine logos need individual handling
- how often the tray is repositioned
A packed tray can reduce tray count and increase labor.
Prototype the Final Span
A one-cavity sample does not prove a 600 mm production tray.
The prototype should represent:
- full length/width
- support
- border
- cavity distribution
- material/Shore
Cavity Orientation Can Improve Packing Without Reducing Support
Rotating a non-round gummy can sometimes increase cavity count while preserving better web thickness than simply reducing center spacing.
Layout optimization should compare:
- orientation
- row staggering
- edge margin
- logo direction
- demolding direction
The highest count is not always the most stable map.
Numbering and Traceability
For production troubleshooting, cavity numbering can help identify whether weight or surface problems repeat in one region. Numbering may live on the tray outside the food-contact cavity rather than on the finished product.
Cleaning Access
Very dense cavity maps can make manual inspection and cleaning more difficult. If fine product residue sits in narrow bridges or deep logo areas, the theoretical throughput gain can be offset by sanitation labor.
Related WYD Pages
Final Recommendation
Optimize the production system—not the CAD packing percentage.
Ready to order custom silicone molds?
Send your drawing, sample or project requirements for DFM and quotation.